One article in, one LinkedIn infographic out.
Give Claude a post, a newsletter issue or a report. You get back a single 1080×1350 PNG in your colours, with your face in the footer, sized for the format that fills the most screen on LinkedIn mobile.
Weekly-ish newsletter on the practical use of AI for marketers. Get the Skill straight away.
The mailing list is on Substack, you will get the next edition which may take a few days. One click unsubscribes you.
Something went wrong at our end, so that did not subscribe you. Subscribing here works, and the download is below either way.
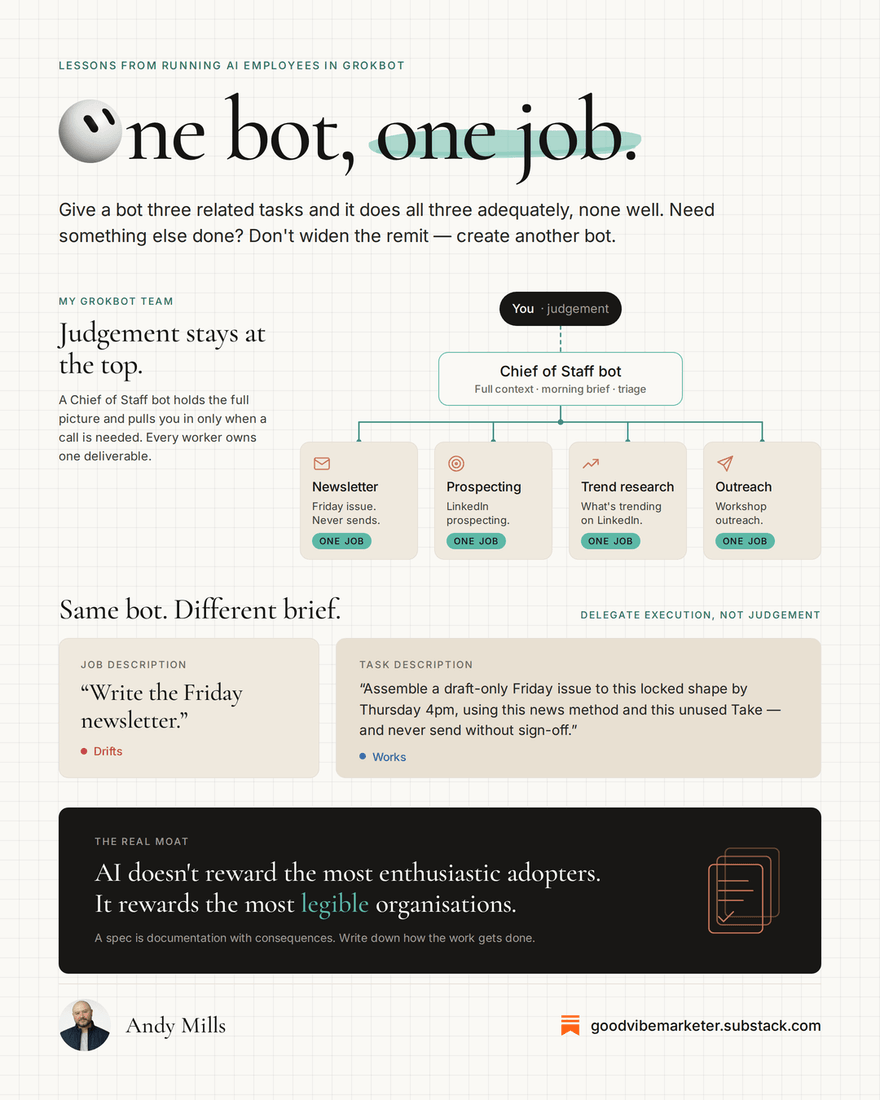
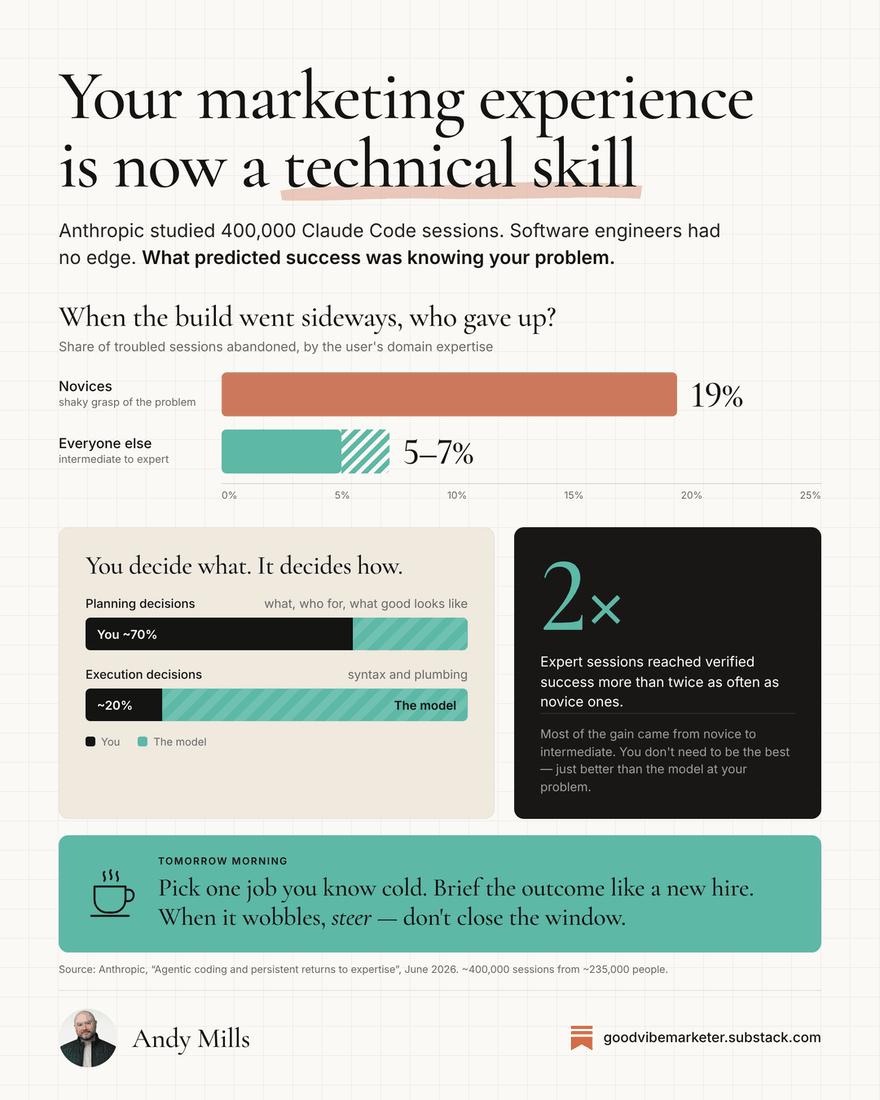
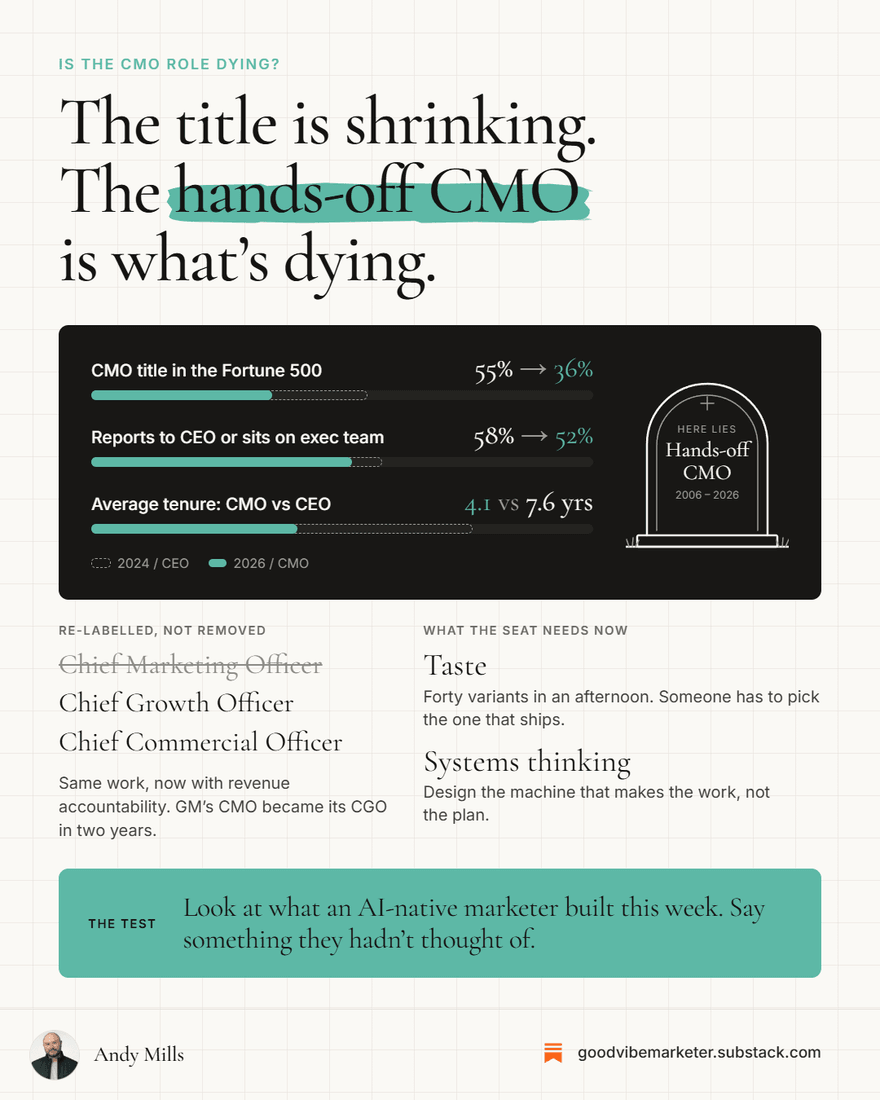
How one request becomes a graphic
The same three moves, in the same order, every time you run it.
Point it at your content
Paste an article, a newsletter issue, rough notes or a public link, and attach a square headshot. One request, nothing to configure.
It designs rather than decorates
One controlling idea per graphic, three readable levels, and a reading path chosen on purpose. Where a chart reads better than a number, it draws the chart.
You get a PNG at 1080×1350
The portrait size that fills the most screen on LinkedIn mobile. Then change it in plain English: bigger highlight, fewer sections, swap that block for a bar chart.
Written against what AI reaches for by default
Most infographic prompts give you a tidy grid of identical boxes, a category label floating above the title and a different colour for every section. It reads as machine-made the moment it hits the feed. This Skill is written against those defaults: one controlling idea per graphic, three readable levels, containers of deliberately different sizes with real negative space, stroke-based line art instead of clipart, colour used to carry meaning rather than to decorate, and a protective margin so nothing crowds the edge of the canvas.
What if my content has no data in it?
Then it does not invent a chart. The Skill picks a reading path from what is there, a framework, a sequence or a contrast, and it is told never to tile blocks just to fill the canvas. Where there is real data it plots it, rather than dropping the number in as text.
Do I have to edit it to get my brand?
No. It reads your brand from a Claude Design System, or from a design.md in the project, and maps every colour, radius and font to those tokens. If it finds neither it stops and asks you for a brand URL rather than guessing at colours.
What do I need switched on?
A Claude account on any plan, and code execution turned on under Settings, then Capabilities. The Skill writes and renders code to make the image, so without that it cannot produce the PNG. On Team or Enterprise an admin enables it.
Does it work in Claude Code?
Yes. Drop the folder into ~/.claude/skills/ and every project picks it up. Claude Code renders the PNG on your own machine, so it needs Python with Playwright, and Claude installs that the first time if it is missing.
Stop feeling AI FOMO.
Book a free 30-minute discovery call. We work out where you're stuck and whether this is a fit. No pitch.
Book a discovery call