
My LinkedIn content engine, in three Claude skills
One finds what your market is talking about this week. Two turn it into posts people save.
-
linkedin-infographic-builderTurn a blog post into one infographic
Makes One 1080×1350 PNG
Give it an article, a newsletter issue or a report. It comes back with a single portrait graphic in your brand, sized for the format that fills the most screen on LinkedIn mobile.
- Reads your Claude Design System for colours, type and logo, so it lands on-brand without editing the skill
- Never invents a statistic. No data in your source means it draws a framework or before/after diagram instead
- One reusable idea per graphic, the kind a buyer screenshots into their own deck
- Your face and name in the footer, because B2B buyers trust people over logos
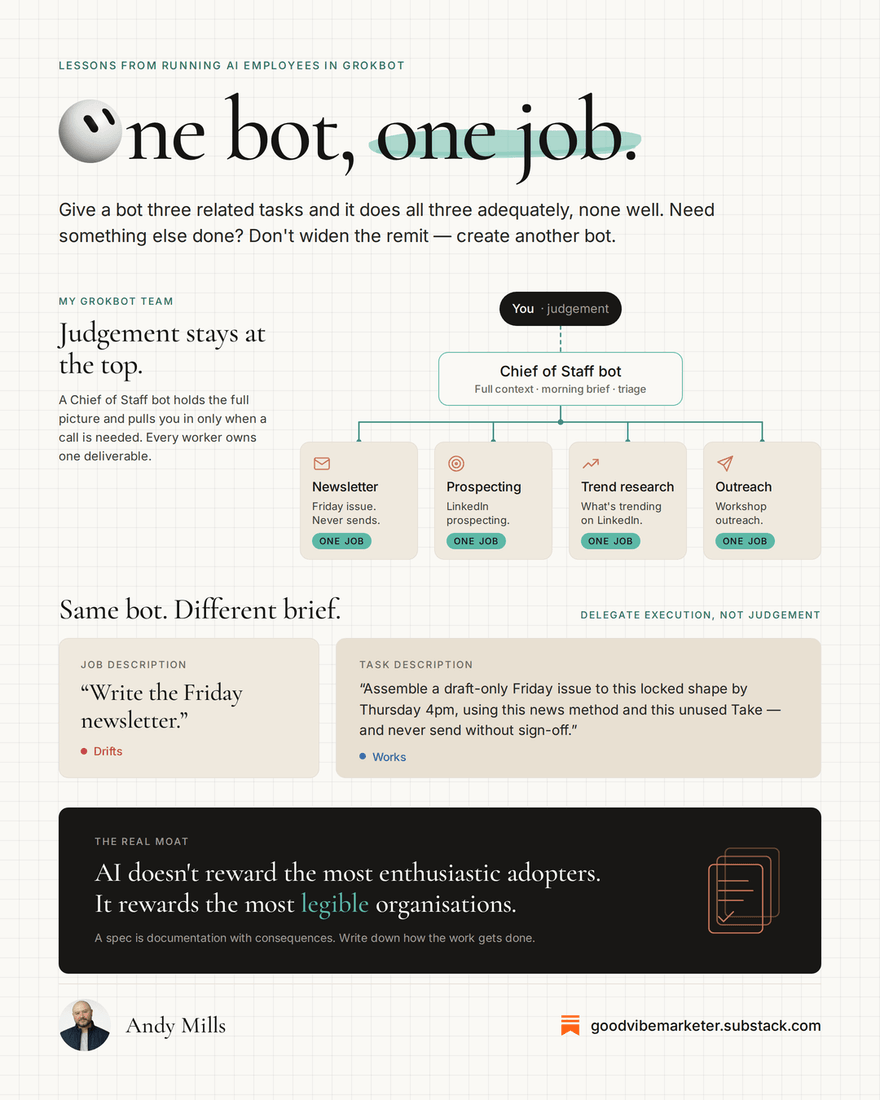
Real output. Made from a Substack post. -
linkedin-carousel-builderTurn a blog post into a carousel
Makes A 6–10 page PDF
The same input, a different shape. It plans the swipe first, finds the one strongest idea in the source and leaves the rest out, then renders a PDF you upload as a LinkedIn document post.
- A PNG of every slide as a secondary output, plus a document title, a caption draft and two alternative hooks
- Every number shows its source on the slide it appears on
- Slide count and order chosen by the argument, not by a template
- Ends on a follow or subscribe slide
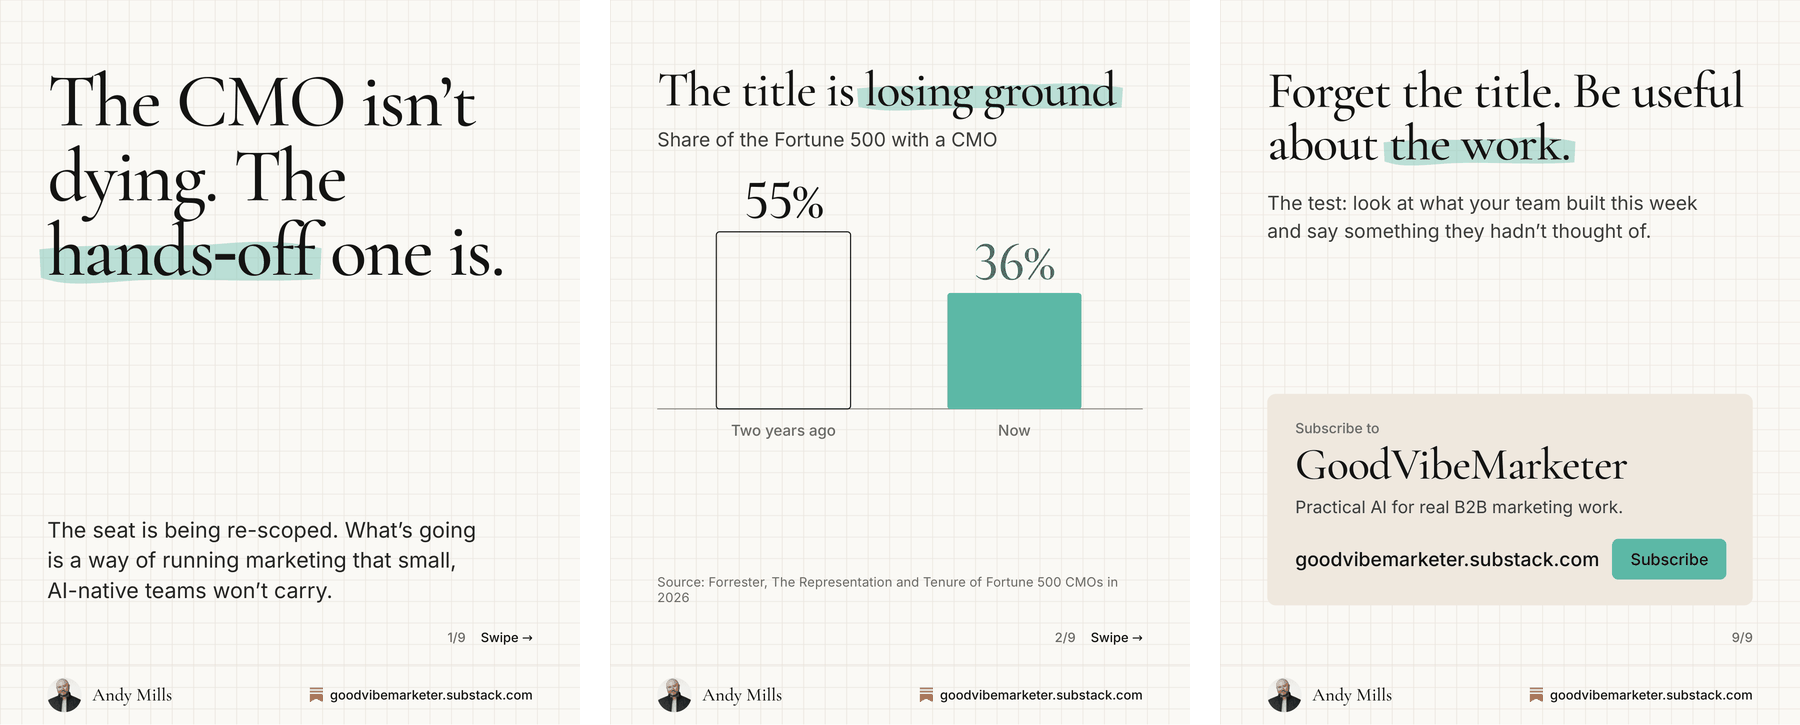
Real output. Slides 1, 2 and 9 of a nine-page carousel. Read the full nine-page PDF -
ai-marketing-trend-radarFind what to post about this week
Makes A report, a page and a PDF
Seven research agents read the last seven days across Reddit, X, YouTube, LinkedIn, Hacker News, trade press and the wider web, then rank what is actually moving and turn each trend into something you could post.
- Every trend carries what happened, why your audience should care, the conversation with verbatim quotes, and three angles — hot take, practical, contrarian — each with a format
- A Trend Score out of 100 does the ranking, weighted from signal, audience relevance, content potential and momentum. Two sources minimum or it drops to rising signals
- Topic, audience and region are settings, so the same skill runs a radar on anything
- Three outputs from one data file — the report in chat, a shareable page and an A4 PDF — so they cannot disagree with each other
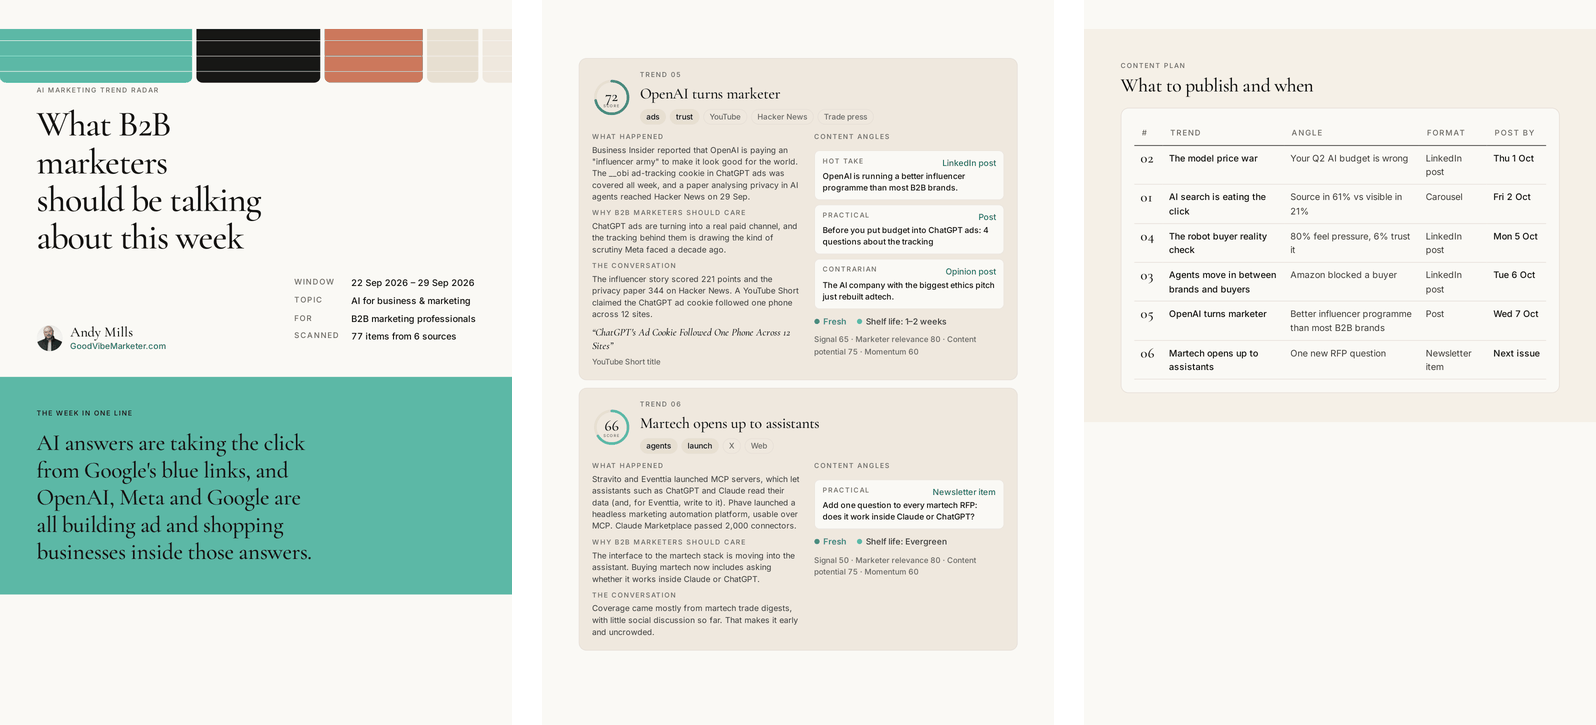
Real output. The cover, a page of trend cards and the content plan, from a fourteen-page report. Read the full fourteen-page report
Two minutes, whichever way you work.
One command
/plugin marketplace add goodvibemarketer/marketing-skills
/plugin install linkedin-infographic-builder@goodvibemarketer-marketing-skills
Swap the skill name for whichever you want. Claude Code then uses it automatically when a request matches.
Upload the ZIP
- Settings → Capabilities, and turn on Code execution and file creation. On Team or Enterprise an admin does this under Organization settings → Plugins & skills.
- Settings → Skills → Upload skill, and choose the ZIP. Don't unzip it first.
- Check the toggle next to the skill is on.
Drop in the folder
Unzip it and move the folder into ~/.claude/skills/ to have it everywhere, or .claude/skills/ inside one project to keep it there. Start a new session and Claude picks it up.
- Any Claude plan. Free, Pro, Max, Team or Enterprise all work.
- Code execution switched on. The two LinkedIn skills write and render code to make the image or PDF.
- Your Design System in Claude. Recommended, not required. It's where your colours, fonts and logo live, so output lands on-brand without you editing the skill.
- A square headshot or brand logo. It goes in the footer of every graphic.
Want the system, not just the skill?
A hands-on session on your own campaigns, building the workflows your team will actually run. Book a free 30-minute call and we'll work out whether it's a fit.
Book a discovery call