
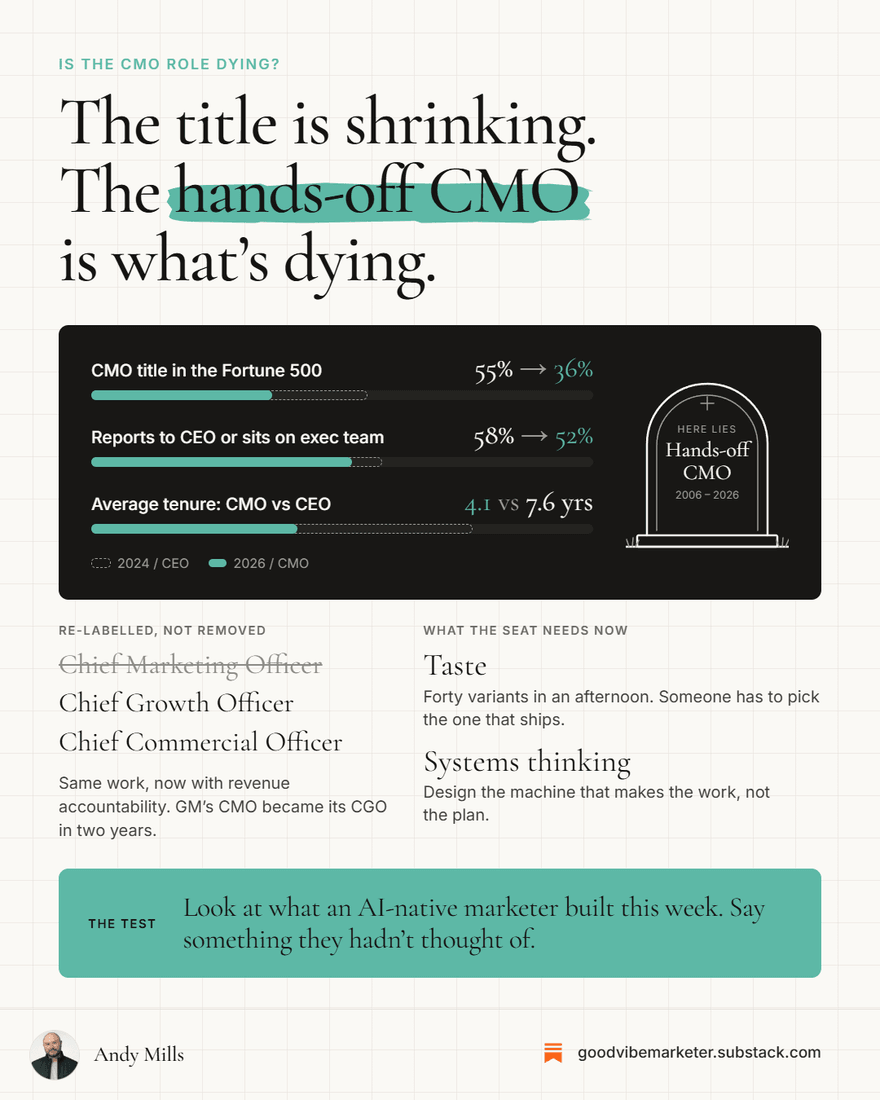
I wrote a post about the CMO role, then turned it into a LinkedIn graphic. Every number on it, the Fortune 500 title share falling from 55% to 36%, the 58% to 52% slide in executive reporting lines, the 4.1 against 7.6 years of tenure, came out of that article. I did not retype any of it or open a design tool. I pasted the post, attached a headshot, and sent one message. That graphic is further down this page, with two others made the same way.
That is the whole job this post is about. You have already done the expensive part, which is having something worth saying. Turning it into a graphic should not cost another afternoon.
Why repurposing stalls
Most marketing teams know they should be getting more out of each article. The reason they do not is rarely strategy. It is that the graphic needs a designer, the designer has a queue, and by the time the queue clears the post is three weeks old and nobody feels like promoting it any more.
So the work either does not happen, or it happens in Canva at 4pm on a Friday and looks it.
The alternative most people reach for is asking an AI for “an infographic about this article”. That gets you a tidy grid of identical boxes, a category label floating above the title, and a different colour for every section. It reads as machine-made the moment it hits the feed, which is worse than not posting.
What actually takes five minutes
Here is the honest breakdown, because “five minutes” usually means “five minutes plus a setup you did not mention”.
- Installing the Skill: about two minutes. You do this once, ever.
- Making the request: under a minute. Paste the post, attach a headshot, send.
- Claude building it: two to three minutes. It writes the layout as HTML and CSS, then renders it in a headless browser at double scale so the type is crisp.
- One round of corrections: about a minute. Plain English, no design tool.
So the first graphic takes seven minutes and every one after that takes five. That is the claim, and it is the one I would hold you to.
What you need first
- A Claude account on any plan. Free, Pro, Max, Team or Enterprise.
- Code execution switched on. Settings, then Capabilities, then Code execution and file creation. On Team or Enterprise an admin turns it on under Organization settings. The Skill writes and runs code to produce the image, so without this there is no PNG at the end.
- Your brand, in a form the Skill can read. A Claude Design System is the clean version. Failing that, a URL it can take colours and fonts from.
- A square headshot or logo. It goes in the footer of every graphic.
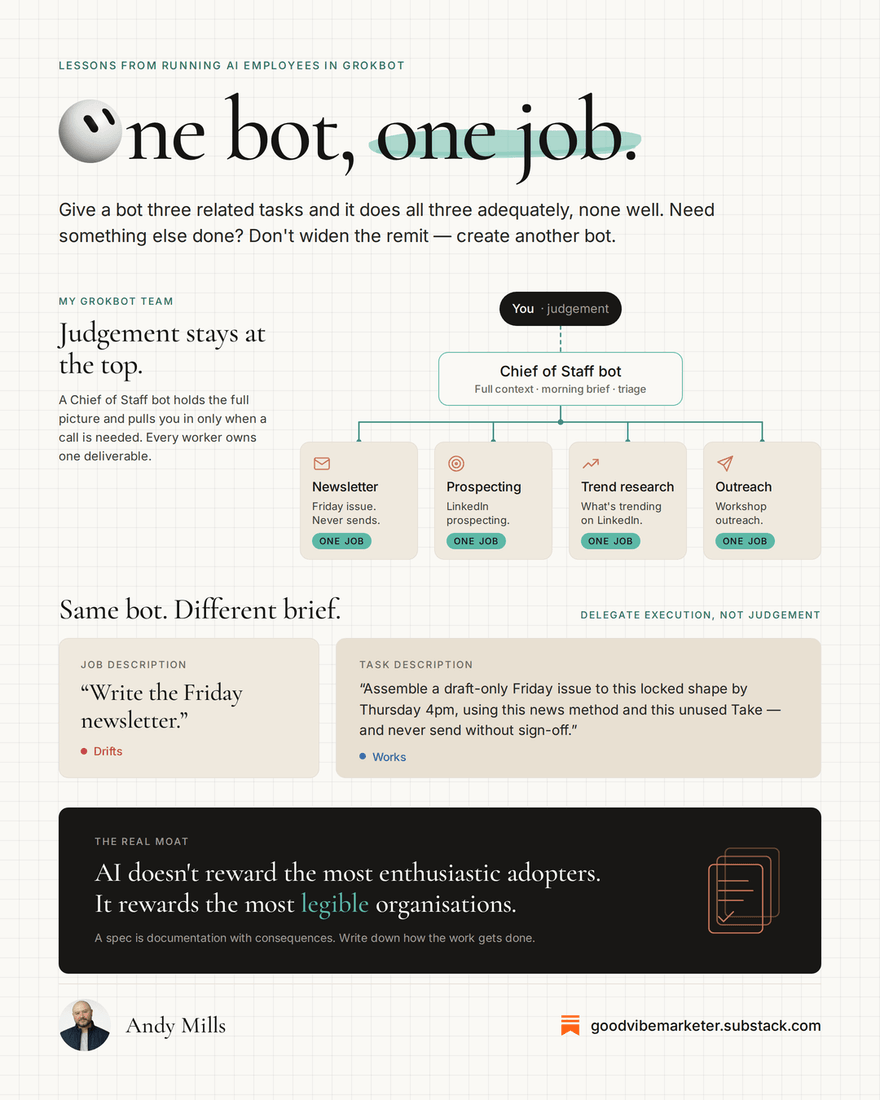
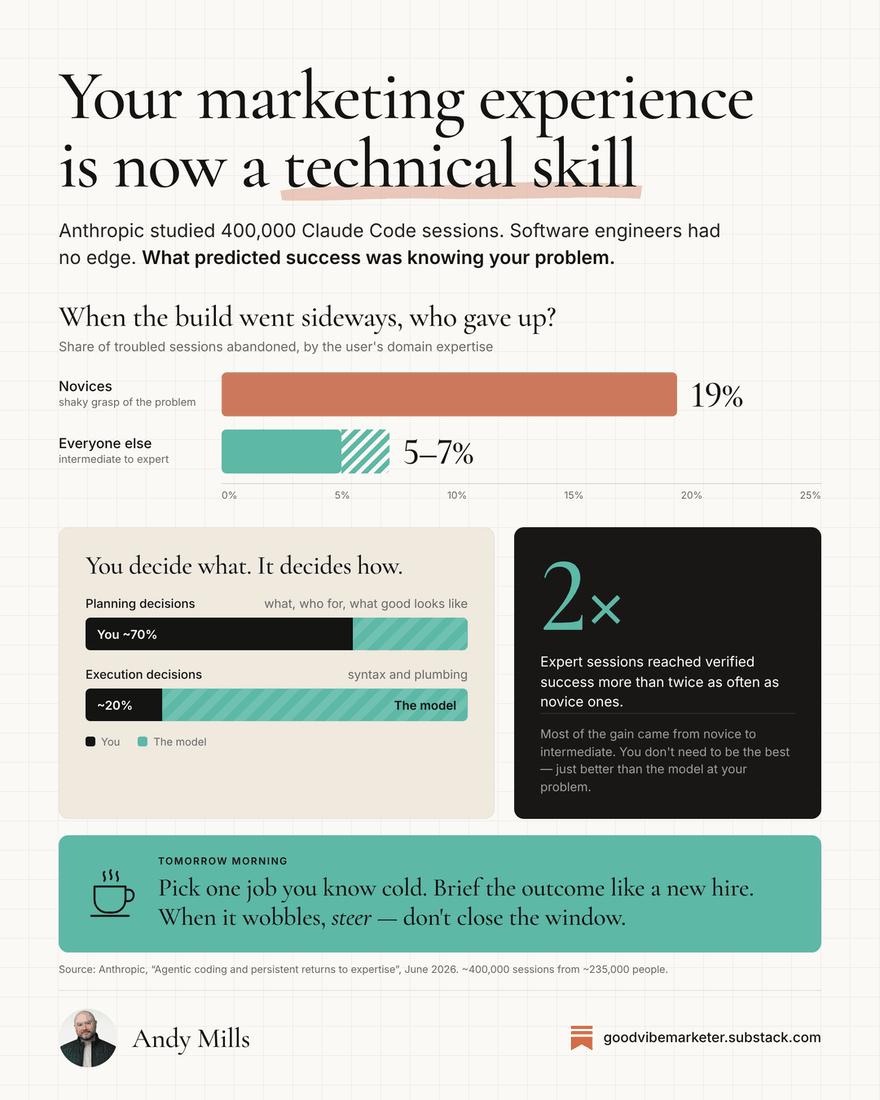
Step 1: install the Skill
In the Claude app, go to Settings, then Skills, and choose Upload skill. Pick the ZIP. Do not unzip it first, which is the single most common reason an upload fails. Check the toggle next to it is on.
In Claude Code, unzip it and move the folder into ~/.claude/skills/ to have it in every project, or .claude/skills/ inside one project to keep it there. Start a new session and Claude picks it up.
Step 2: pick a post that will survive the compression
This is the step people skip, and it is the one that decides whether the output is any good.
A 1080x1350 canvas holds three to six sections. That is maybe sixty words of body copy. An article has to have something underneath the prose to survive that, and not every article does.
Posts that work:
- Ones with a number that moved. A trend, a decline, a before and after.
- Ones with a framework, even an informal one. Three types of something, four stages, two options and a choice between them.
- Ones built on a contrast. The thing everyone believes against the thing that is actually true.
- Ones with a process that has an order to it.
Posts that do not work:
- Pure narrative. A story compresses into a worse story.
- Opinion with no structure under it. If the argument is “here is what I think”, there is nothing to draw.
- Anything where the value is in the sentences themselves.
The CMO post worked because it had both a number that moved and a contrast: the title is shrinking, but what is actually dying is the hands-off version of the job. That contrast became the headline, and the numbers became the chart.
Step 3: make the request
Start a new chat, type /, and pick the Skill from the list. Open the Output dropdown underneath the message box and select Design. Choose your brand’s Design System if you have one.
Then paste your article, attach your headshot, and say what the graphic is for. Something like:
Turn this post into a LinkedIn infographic. The argument is that the CMO title is shrinking but the hands-off CMO is what is actually dying. Lead with the Fortune 500 numbers.
You do not have to brief the design. That part is already written down inside the Skill, which is the whole point of it being a Skill rather than a prompt you rewrite each time.
Step 4: correct it in plain English
You will want a second pass. Almost everyone does. The instructions that work are the ones you would give a designer:
- “Fewer sections, the middle block is doing too much.”
- “Make the chart bigger and drop the third statistic.”
- “Swap that list for a before and after.”
- “The headline is too long, cut it to six words.”
In the Claude app it builds on a Design canvas, so you can also click straight into any text and edit it yourself.
Step 5: check it before you post
The Skill composed the graphic. You are the one publishing it, so read every number back against your source, check the subject is named, and check your own name and link are right in the footer.
What the Skill is actually enforcing
The reason the output does not look generated is that the Skill spends most of its instructions ruling things out rather than asking for them.
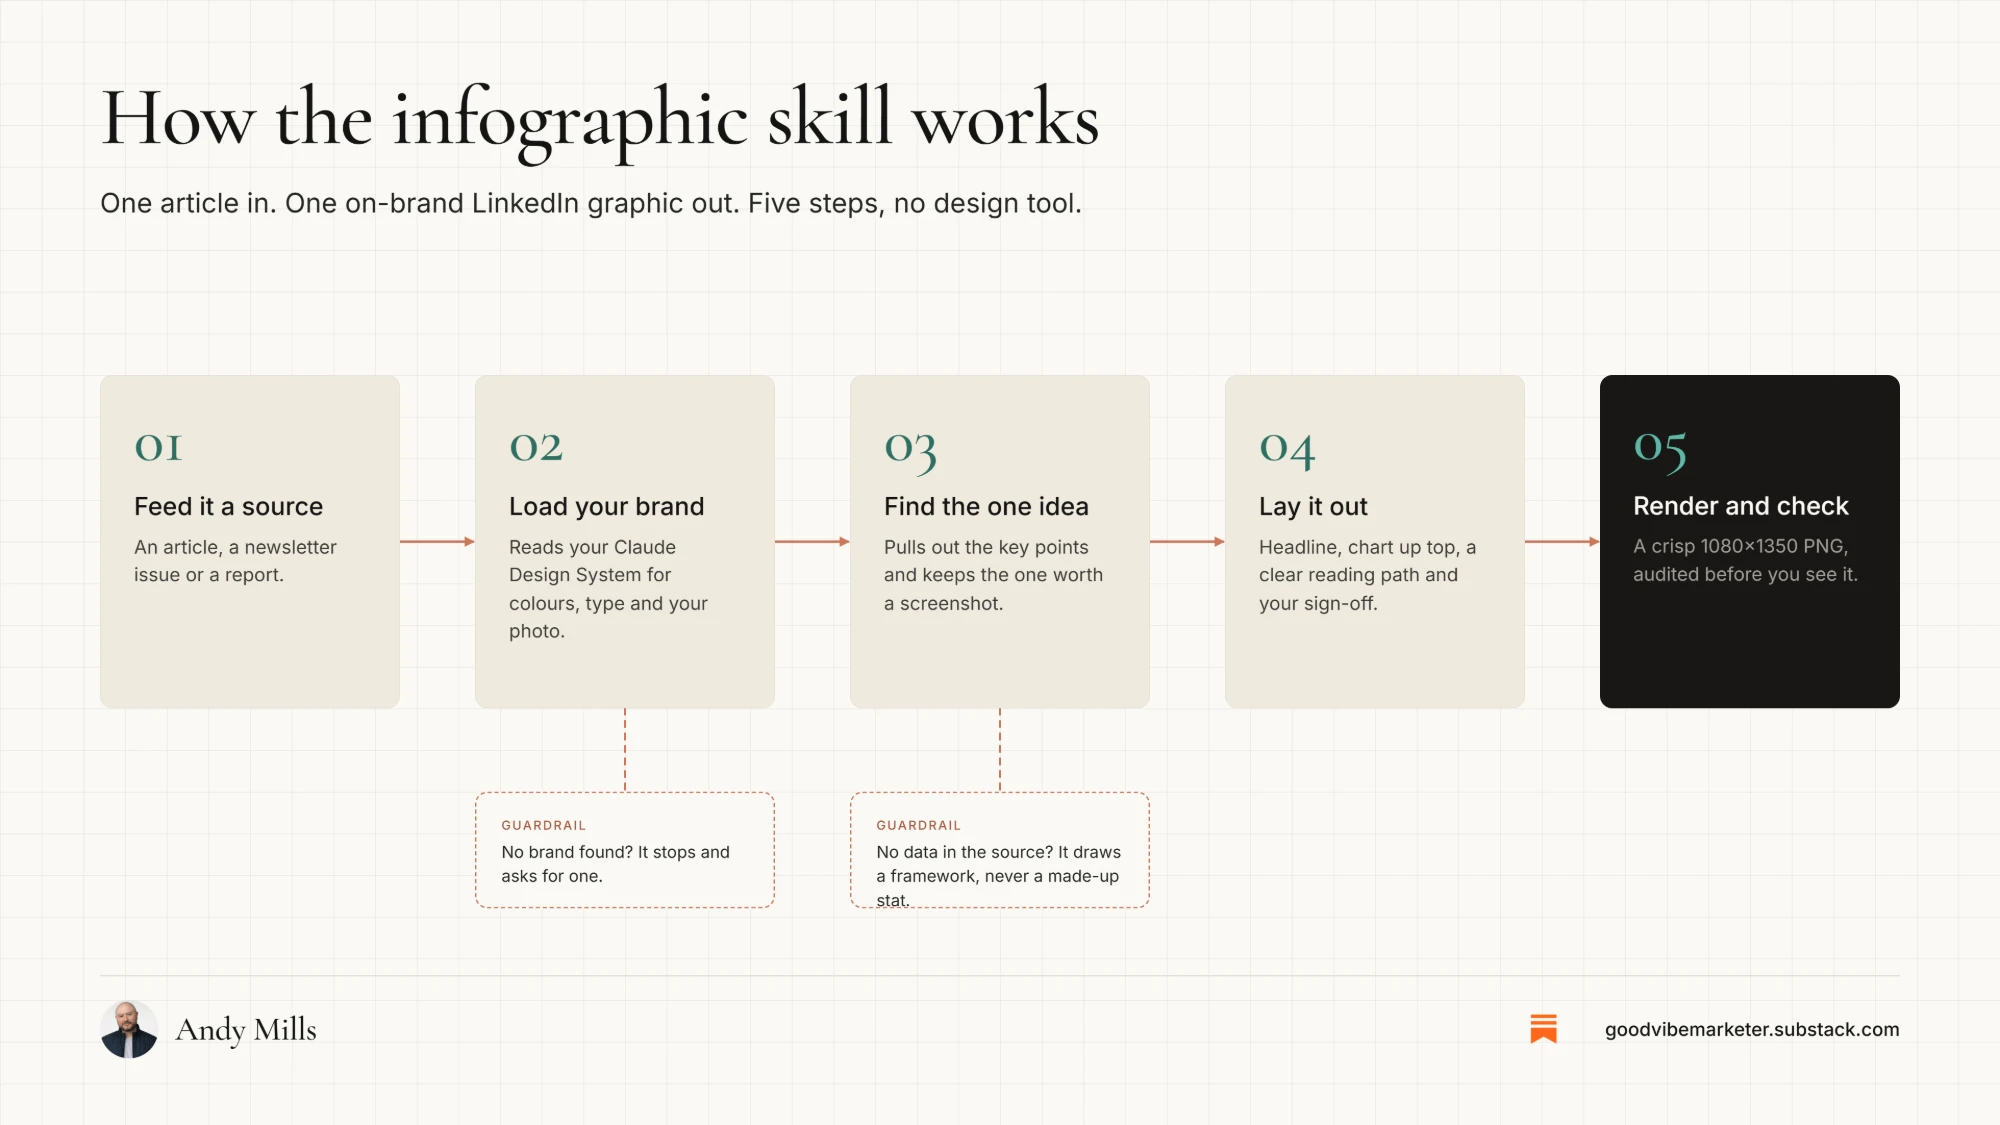
The five stages, and the two places it refuses rather than guesses. Open full size.
- One controlling idea per graphic. It states the single claim the image makes, and everything on the canvas has to serve it.
- Three readable levels. The two-second takeaway, the ten-second skim, and the detail you only read if you are interested.
- No eyebrow slop. No category labels, tracking lines or taglines floating above the title. The top of the canvas is clean margin leading into the headline.
- Asymmetry on purpose. Containers are deliberately different sizes, with real negative space. It is told never to tile blocks just to fill the canvas.
- Line art, not clipart. Graphical metaphors are stroke-based vectors. The tombstone on the CMO graphic is drawn, not dropped in.
- Colour carries meaning. Accent colours are reserved for specific callouts and semantic states, not sprinkled per section.
- Charts where a chart reads better. Where there is real data, it is told to plot it in the top third rather than drop the number in as text.
Those are design decisions somebody made once, written down, and applied identically every run. That is the difference between a Skill and a good prompt: the method lives outside the conversation, so you improve the rules rather than the wording.
Questions people ask
How long does it really take to turn a blog post into an infographic?
About five minutes per graphic once the Skill is installed, and roughly seven the first time because installing it takes two. Most of that is Claude working rather than you: the request is one message, and the build is a couple of minutes of rendering. The part that actually takes judgement is choosing which post to repurpose.
Do I need design skills to make a LinkedIn infographic this way?
No, but you do need editorial judgement. The layout, type scale, colour logic and composition are decided inside the Skill. What you bring is knowing which article has a structure underneath it, and being able to say “fewer sections” or “lead with the chart” when the first version is not right.
What size should a LinkedIn infographic be?
1080x1350 pixels, a 4:5 portrait. It is the shape that fills the most screen on a phone, which is where most B2B scrolling happens. The Skill outputs exactly that size every time rather than leaving it to chance.
Will it match my brand?
It takes colours, fonts, spacing and radii from design tokens: a Claude Design System, or a design.md if you are working in a code project. If it cannot find either, it stops and asks you for a brand URL rather than guessing at colours. That pause is deliberate. Guessed brand colours are worse than no graphic.
Can I use the same approach for carousels?
Yes, but it is a different Skill. A carousel is a multi-page PDF with its own pacing problem, where an infographic is one canvas with one idea on it. Trying to make one tool do both produces something that is bad at each.
Is the Skill free?
Yes, and it is MIT licensed on GitHub, so you can read every rule before you run it. That is rather the point: the instructions are visible, so you can disagree with one and change it.
Get the Skill
It is free, and it takes two minutes to install. Grab the LinkedIn infographic Skill here →
The broader point is not this one graphic. It is that most of the marketing work you repeat is a judgement you make the same way every time, and judgements can be written down. That is what we spend the day on in the AI marketing workshops: finding the ones worth encoding, and writing them properly.